The Science of Plastic
Does Bottled Water Have More Microplastics Than Tap?
A peer-reviewed review tracked microplastics in tap and bottled water. The gap is real—and where the particles come from is more surprising than the bottle itself.
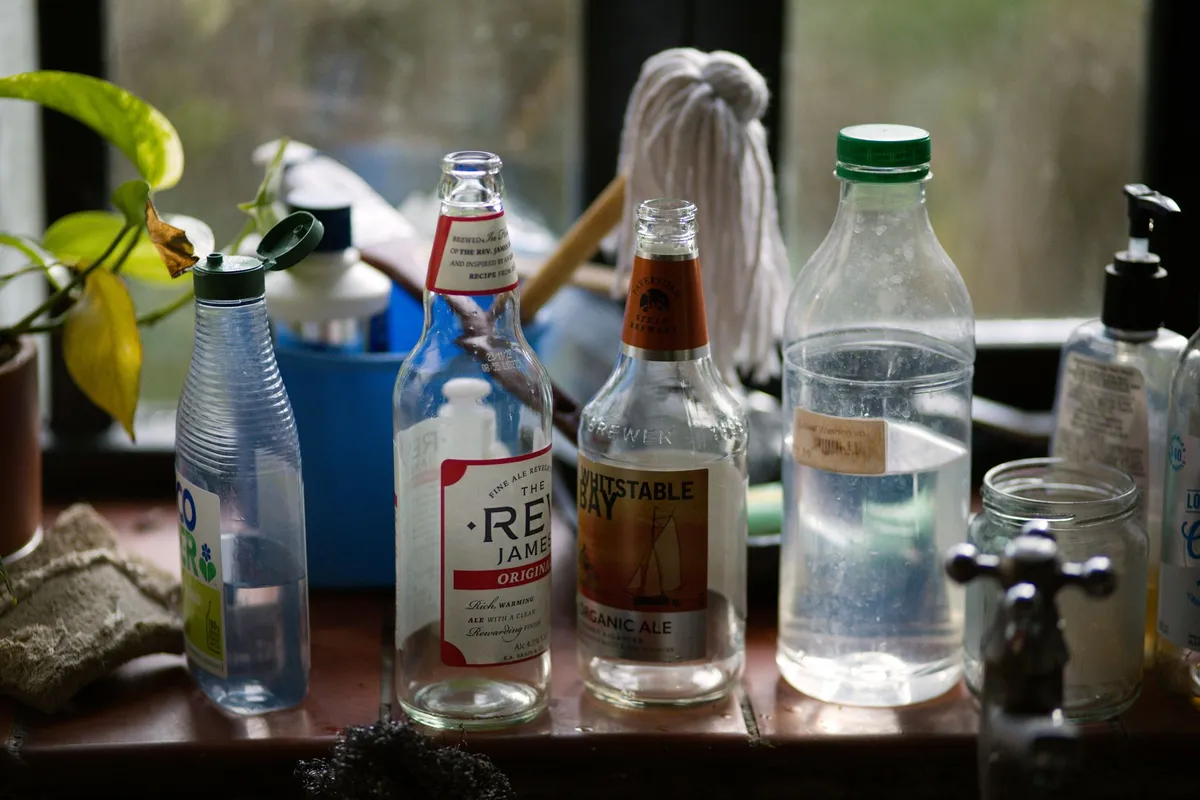
Most people assume tap water is the compromised option and bottled water is the clean upgrade. The peer-reviewed evidence points the other way. In one review of drinking water sources, average concentrations were 94.37 microplastics per liter in bottled water against 4.23 per liter in tap water [Polymers, 2023].
That is not a small difference, and it reframes a habit millions of people treat as a health precaution. But the more useful story isn’t “bottled bad, tap good” — it’s where the particles come from, how confident the science actually is, and what a reader can reasonably do about it.
The tap-versus-bottled gap is real, but the numbers are messy
The headline contrast — roughly 94 versus 4 microplastics per liter — comes from a research paper cited within this review [Polymers, 2023]. It is a striking gap, but the same review makes clear that microplastic counts swing enormously depending on the brand, the sampling method, and the laboratory technique.
94.37 vs 4.23
Microplastics per liter — bottled water vs tap water (cited average)
Polymers, 2023
Consider the range across different studies compiled in the review. Bottled mineral water has been reported anywhere from under 1 particle per liter to 317 ± 257 particles per liter in one FTIR study, while a µ-Raman study of Bavarian mineral waters reported single-use PET bottles at 2,649 ± 2,857 MPs/L and reusable PET bottles at 4,889 ± 5,432 MPs/L [Polymers, 2023]. Tap water studies show their own spread — one survey of 159 samples across 14 countries found an overall mean of 5.45 MPs/L, ranging from 0 to 61 MPs/L [Polymers, 2023].
The takeaway isn’t a single clean ratio. It’s that bottled water tends to carry a heavier microplastic load, but the exact number depends heavily on how and what you measure.
Note
Different labs use different methods — FTIR, µ-Raman, pyrolysis–GC/MS — with different size detection limits. A study that can only see particles above 10 µm will report far fewer than one resolving down to the nanometer scale. Comparing raw counts across studies is genuinely difficult.
The cap may matter more than the bottle
Here’s the part that reframes the whole debate. A large share of the microplastics in bottled water doesn’t appear to come from the bottle sitting on a shelf — it comes from using it.
According to research reviewed in the paper, microplastics and nanoplastics can contaminate bottled water when the screw cap is opened and closed [Polymers, 2023]. One study found that 81% of the microplastics detected in bottled drinking water were attributed to abrasion of the polyethylene-based cap sealing material [Polymers, 2023]. Another reported that a single opening of a plastic bottle can produce between 0.46 and 250 microplastic particles per centimeter of cap travel [Polymers, 2023].
The mechanism scales with handling. In one experiment on drinking water stored in plastic bottles, 53 to 393 particles per milliliter were released across 100 opening-and-closing cycles [Polymers, 2023]. The friction of the cap threads, repeated each time you take a sip and reseal, is doing measurable work.
Glass bottles are not the guaranteed escape hatch
If the bottle body were the whole problem, glass would solve it. It doesn’t — at least not cleanly.
In a µ-Raman study of Bavarian mineral waters reviewed here, glass bottles showed 6,292 ± 10,521 microplastics per liter — a higher average than either single-use or reusable PET bottles in the same study [Polymers, 2023]. The particles found in glass-bottled water were largely polyethylene and polypropylene, consistent with a cap or closure source rather than the glass itself [Polymers, 2023]. Researchers attributed some of the glass-bottle contamination to the age of the bottle and its handling.
There is a genuine caveat here worth stating honestly: separately, when water was analyzed in glass bottles using µ-FTIR in another cited study, the detected microplastics fell below the limit of quantification [Polymers, 2023]. So the evidence on glass is mixed, and it clearly depends on the closure and the analytical method. What glass does not earn is an automatic clean bill of health.
Key takeaway
The consistent thread across these studies is closures and handling, not the container material alone. A glass bottle with a plastic-lined cap is not a microplastic-free vessel.
The particles are smaller than most instruments can see
Part of why this field is unsettled is that the most concerning particles are the hardest to detect. The review notes that most analytical methods were established for particles larger than 10 µm, and entirely new approaches are needed to identify nanoplastics below 1 µm [Polymers, 2023].
The smallest nanoplastic identified using pyrolysis–gas chromatography–mass spectrometry in this body of work had a diameter of just 58 nanometers [Polymers, 2023]. One tap water study quantified nanoplastics ranging from 58 to 255 nm as polyolefins, polystyrene, PVC, and polyamide [Polymers, 2023]. For scale, these particles are hundreds of times smaller than the width of a human hair — and standard microplastic counts often miss them entirely.
58 nm
Smallest nanoplastic identified by Pyr-GC/MS in this research
Polymers, 2023
That matters because smaller particles are the ones researchers worry about most. The review notes that nanoplastics are considered to pose an increasing potential risk relative to microplastics, owing to their higher surface-area-to-volume ratio, which increases their potential as carriers of chemical contaminants [Polymers, 2023].
What we actually know about the health risk — and what we don’t
This is where honesty matters more than alarm. The review is direct: the toxicological mechanisms by which microplastics and nanoplastics affect human health are still unknown [Polymers, 2023].
Most of the evidence base is indirect. As the authors put it, few published papers have addressed direct human health effects; most research involves animal studies, mathematical modeling, or in vitro cell culture [Polymers, 2023]. In organisms, these particles have been associated with oxidative stress, cytotoxicity, inflammatory responses, and other effects, but health risk depends on concentration, exposure duration, route, and the particles’ physicochemical properties [Polymers, 2023].
There are also findings pointing the other way. One study exposing human lymphoblastic cell lines to PET nanoplastics recovered from drinking water bottles found cellular uptake but no significant biological effects and no clear health hazard in that preliminary work [Polymers, 2023]. Another line of concern comes from additives rather than the plastic itself: a study of reusable plastic and glass sport bottles found migration of more than 400 plastic-related compounds into drinking water over 24 hours [Polymers, 2023].
Caution
The review’s own conclusion is that it should not be assumed any level of these particles is safe — but also that comprehensive studies are still needed to establish a clear health-risk assessment. That is a statement of uncertainty, not a proven danger. Treat any source claiming a settled health verdict with suspicion.
What a reasonable person should actually do
The evidence doesn’t support panic, and it doesn’t support treating bottled water as a safe upgrade either. A few practical points follow directly from what the research shows:
- Favor tap water where it’s safe to drink. The cited averages put it well below bottled water for microplastic load [Polymers, 2023], and it sidesteps the cap-abrasion problem entirely.
- Minimize opening and reclosing plastic bottles. Since repeated cap cycles measurably shed particles [Polymers, 2023], a bottle you open once releases less than one you crack and reseal all day.
- Don’t assume glass is a cure. The closure matters, and glass-bottled water was not consistently cleaner across the studies reviewed [Polymers, 2023].
- Know that filtration helps but isn’t total. Point-of-use devices combining microfiltration with granular activated carbon and ion exchange removed up to 100% of PVC and 94% of PET in one study [Polymers, 2023], but the review is explicit that no single method removes everything and combinations are often needed [Polymers, 2023].
The most defensible position the science currently supports is modest: reduce needless exposure where it’s easy, stay skeptical of marketing that promises a clean container, and watch the research as detection methods for the smallest particles mature.
Sources
- Polymers, 2023 Insights into Anthropogenic Micro- and Nanoplastic Accumulation in Drinking Water Sources and Their Potential Effects on Human Health Read the source ↗
Frequently asked questions
- Does bottled water contain more microplastics than tap water?
- In one cited study, average concentrations were 94.37 microplastics per liter in bottled water versus 4.23 per liter in tap water. But concentrations vary widely by brand, method, and how the bottle is handled.
- Do the caps on water bottles shed microplastics?
- Research reviewed in the paper found that a large share of microplastics in bottled water traced to abrasion of the cap-sealing material and to opening and closing the screw cap, not just the bottle body.
- Are glass bottles microplastic-free?
- No. One study reviewed in the paper actually found more microplastic particles in glass-bottled mineral water than in plastic bottles, likely from the cap and bottle handling.
More on The Science of Plastic
The Science of Plastic
Why Nanoplastics in Drinking Water Are So Hard to Measure
Nanoplastics have been found in tap and bottled water, but the numbers are hard to trust. The real problem is measurement science, not just contamination.

The Science of Plastic
How Many Microplastics Are in Bottled Water? A New Count
A 2026 study counted up to 12,080 microplastic particles per liter of bottled water and showed they can slip inside human cells. Here is what the numbers mean.

The Science of Plastic
What 240,000 Microplastics Per Liter Actually Means For Your Body
The bottled-water stat gets quoted constantly. Here's where those particles actually go once you swallow them, and what's still genuinely unknown.